
DigitalOcean Kubernetes Monitoring made easy using Robusta
Introduction
Kubernetes solved many challenges with distributed environments, such as speed, scalability, and resilience. However, the flexibility and scalability that Kubernetes brings in deploying containerized applications also presents new challenges. Since there is no longer a 1-to-1 correlation between an application and the server it runs on, keeping track of the health of applications — abstracted by containers and once again by Kubernetes — can be daunting without the proper tools.
At DigitalOcean, we pride ourselves on offering straightforward and easy-to-use solutions. We have taken a similar approach to DigitalOcean Kubernetes monitoring. Find below the different approaches to setting up the observability stack on DigitalOcean Kubernetes.
-
DIY Observability stack which comprises of
- Prometheus for monitoring
- Loki to fetch and aggregate logs resources
- Grafana dashboards
- AlertManager to alert and notify
-
Robusta: All-in-one observability stack designed for Kubernetes
Includes Prometheus, Grafana, AlertManager, and a solution for viewing logs, but it’s been designed as an all-in-one package optimized for Kubernetes.
In this article, we will focus on Robusta.
Robusta on DigitalOcean Kubernetes
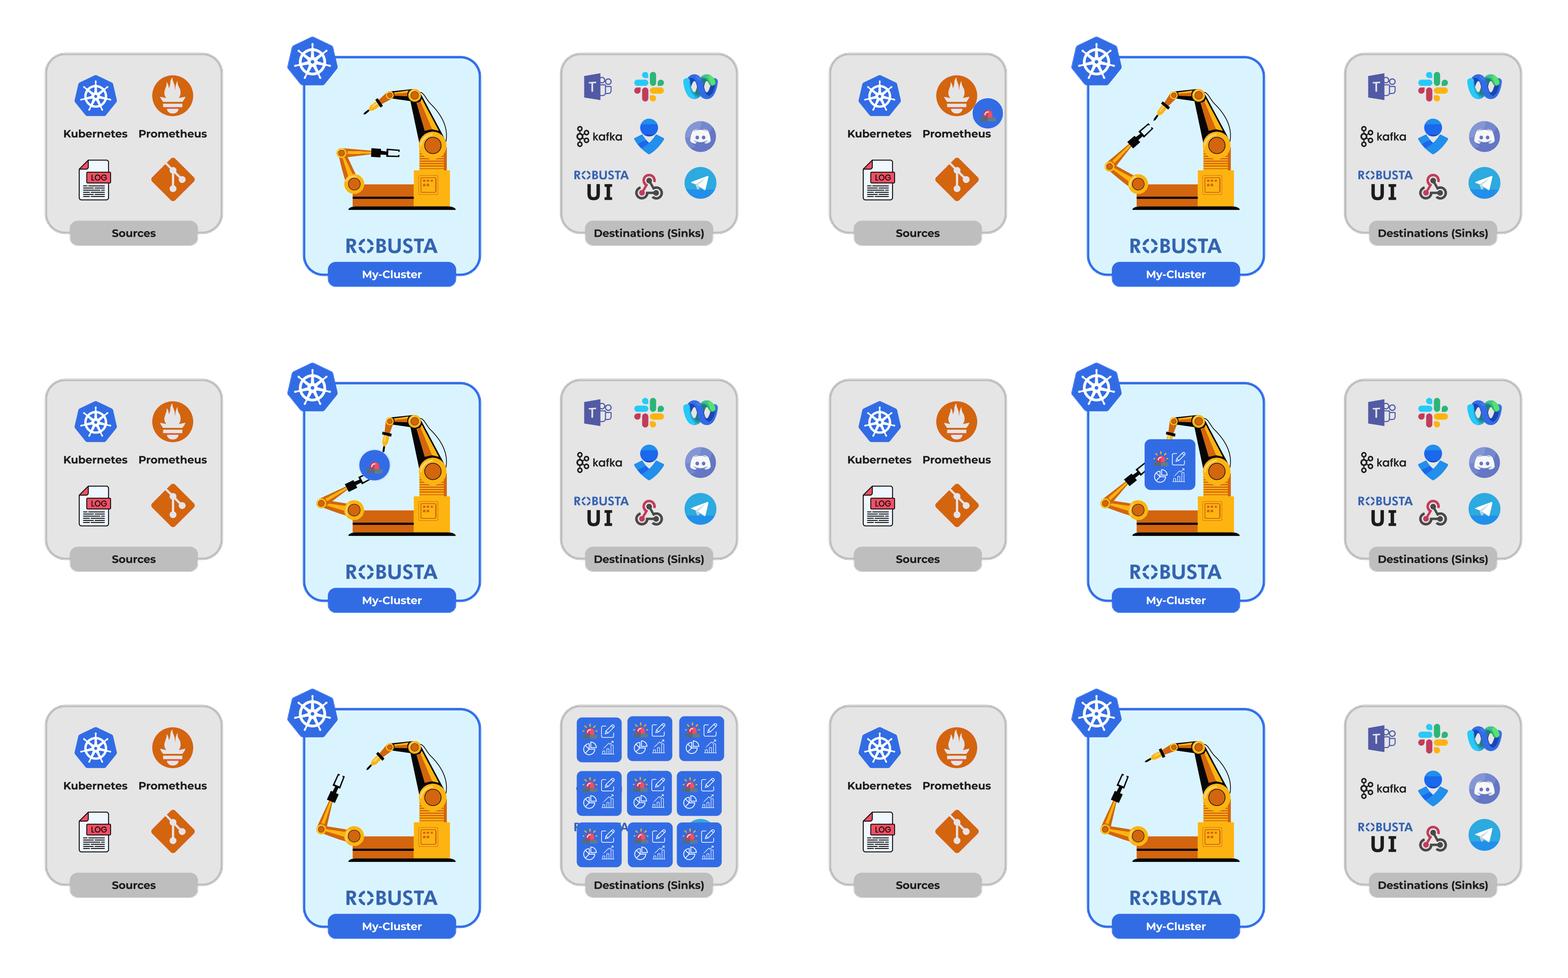
Robusta is an open-source Kubernetes monitoring, troubleshooting, and automation platform which comes pre-baked with
- Embedded Prometheus stack with pre-configured alerts
- A web ui to see all alerts, changes, and events in your cluster, including timeline and root cause analysis
- Alert enrichment and automatic remediation through a powerful automation engine
- Multi-cluster observability
Target Audience
- Kubernetes novices and enterprises that want to monitor clusters without spending tons of time defining and tweaking alerts
- Organizations that already run DigitalOcean Kubernetes clusters with existing monitoring stacks. These users typically tend to have alerts in place and use Robusta to explore, remediate, and otherwise manage them
- Teams with multi-cluster or multi-tenant environments, either all on DigitalOcean, or spanning multiple clouds
Prerequisites
Robusta Architecture
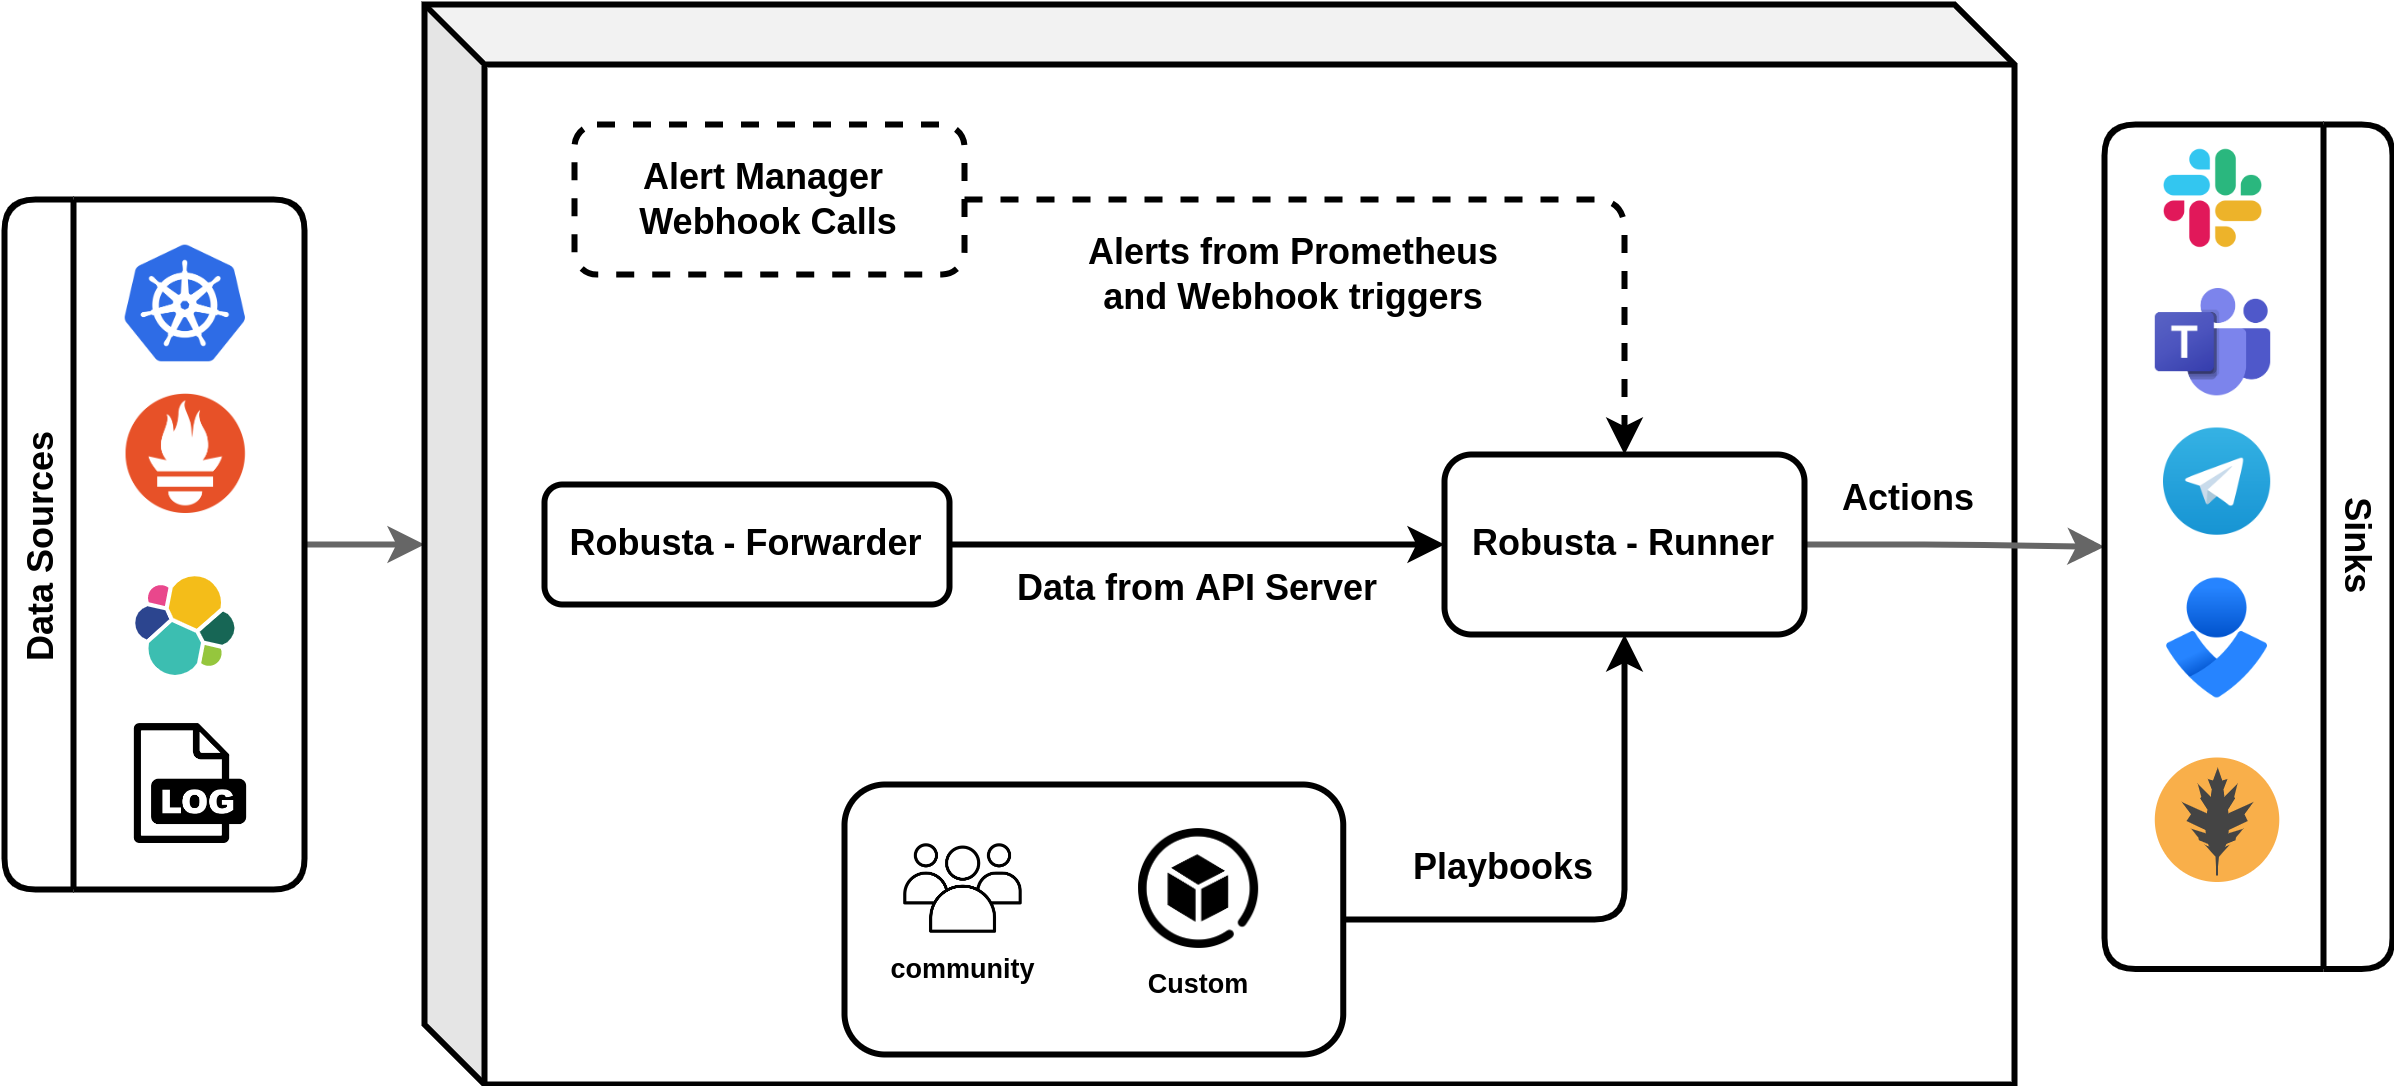
Automation engine
The main component of Robusta is the automation engine, which runs in a cluster as Kubernetes deployments.
-
robusta-forwarder: connects to the APIServer, monitors Kubernetes changes, and forwards them to robusta-runner.
-
robusta-runner: executes playbooks.
Installation
-
Install the
robusta-cli: This step is needed to generate the values file for helm chart installation.# Requires python installed python3 -m pip install -U robusta-cli --no-cache -
Generate a
generated_values.yamlfor the Robusta chart:# An interactive session where you can configure sinks # such as receiving alerts to a particular Slack channel, MS Teams. # This generates a `generated_values.yaml` robusta gen-config -
Update DigitalOcean cluster credentials using
doctl:# Notice: Adding cluster credentials to kubeconfig file found in "/Users/<username>/.kube/config" # Notice: Setting current-context to <cluster-context> doctl kubernetes cluster kubeconfig save <cluster-id> -
Install Robusta with
helm:helm repo add robusta https://robusta-charts.storage.googleapis.com && helm repo update helm install robusta robusta/robusta -f ./generated_values.yaml --set clusterName=<cluster-name>
For more details on the installation »
Post-Installation
Access Robusta Web UI
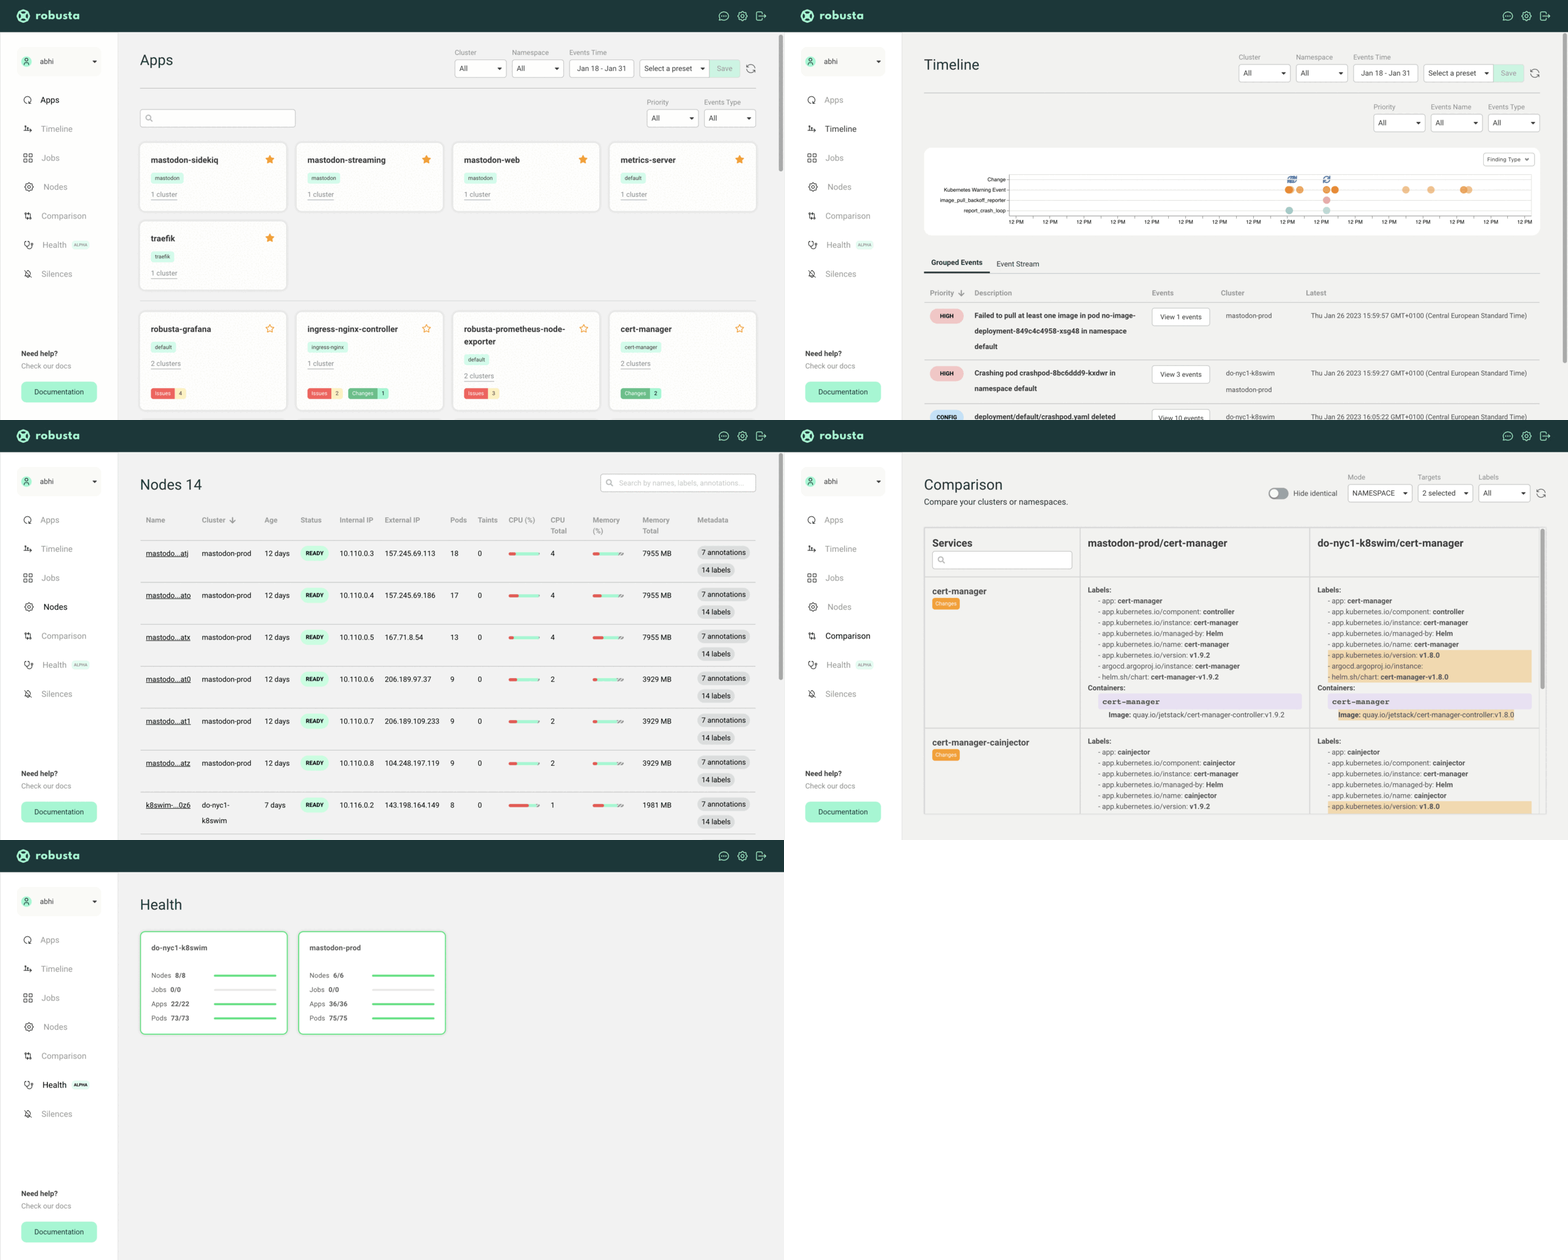
Upon successful installation, head to https://platform.robusta.dev/ and sign in with the email/account used during the installation process.
Here is an example view of the Robusta SaaS platform
Slack integration
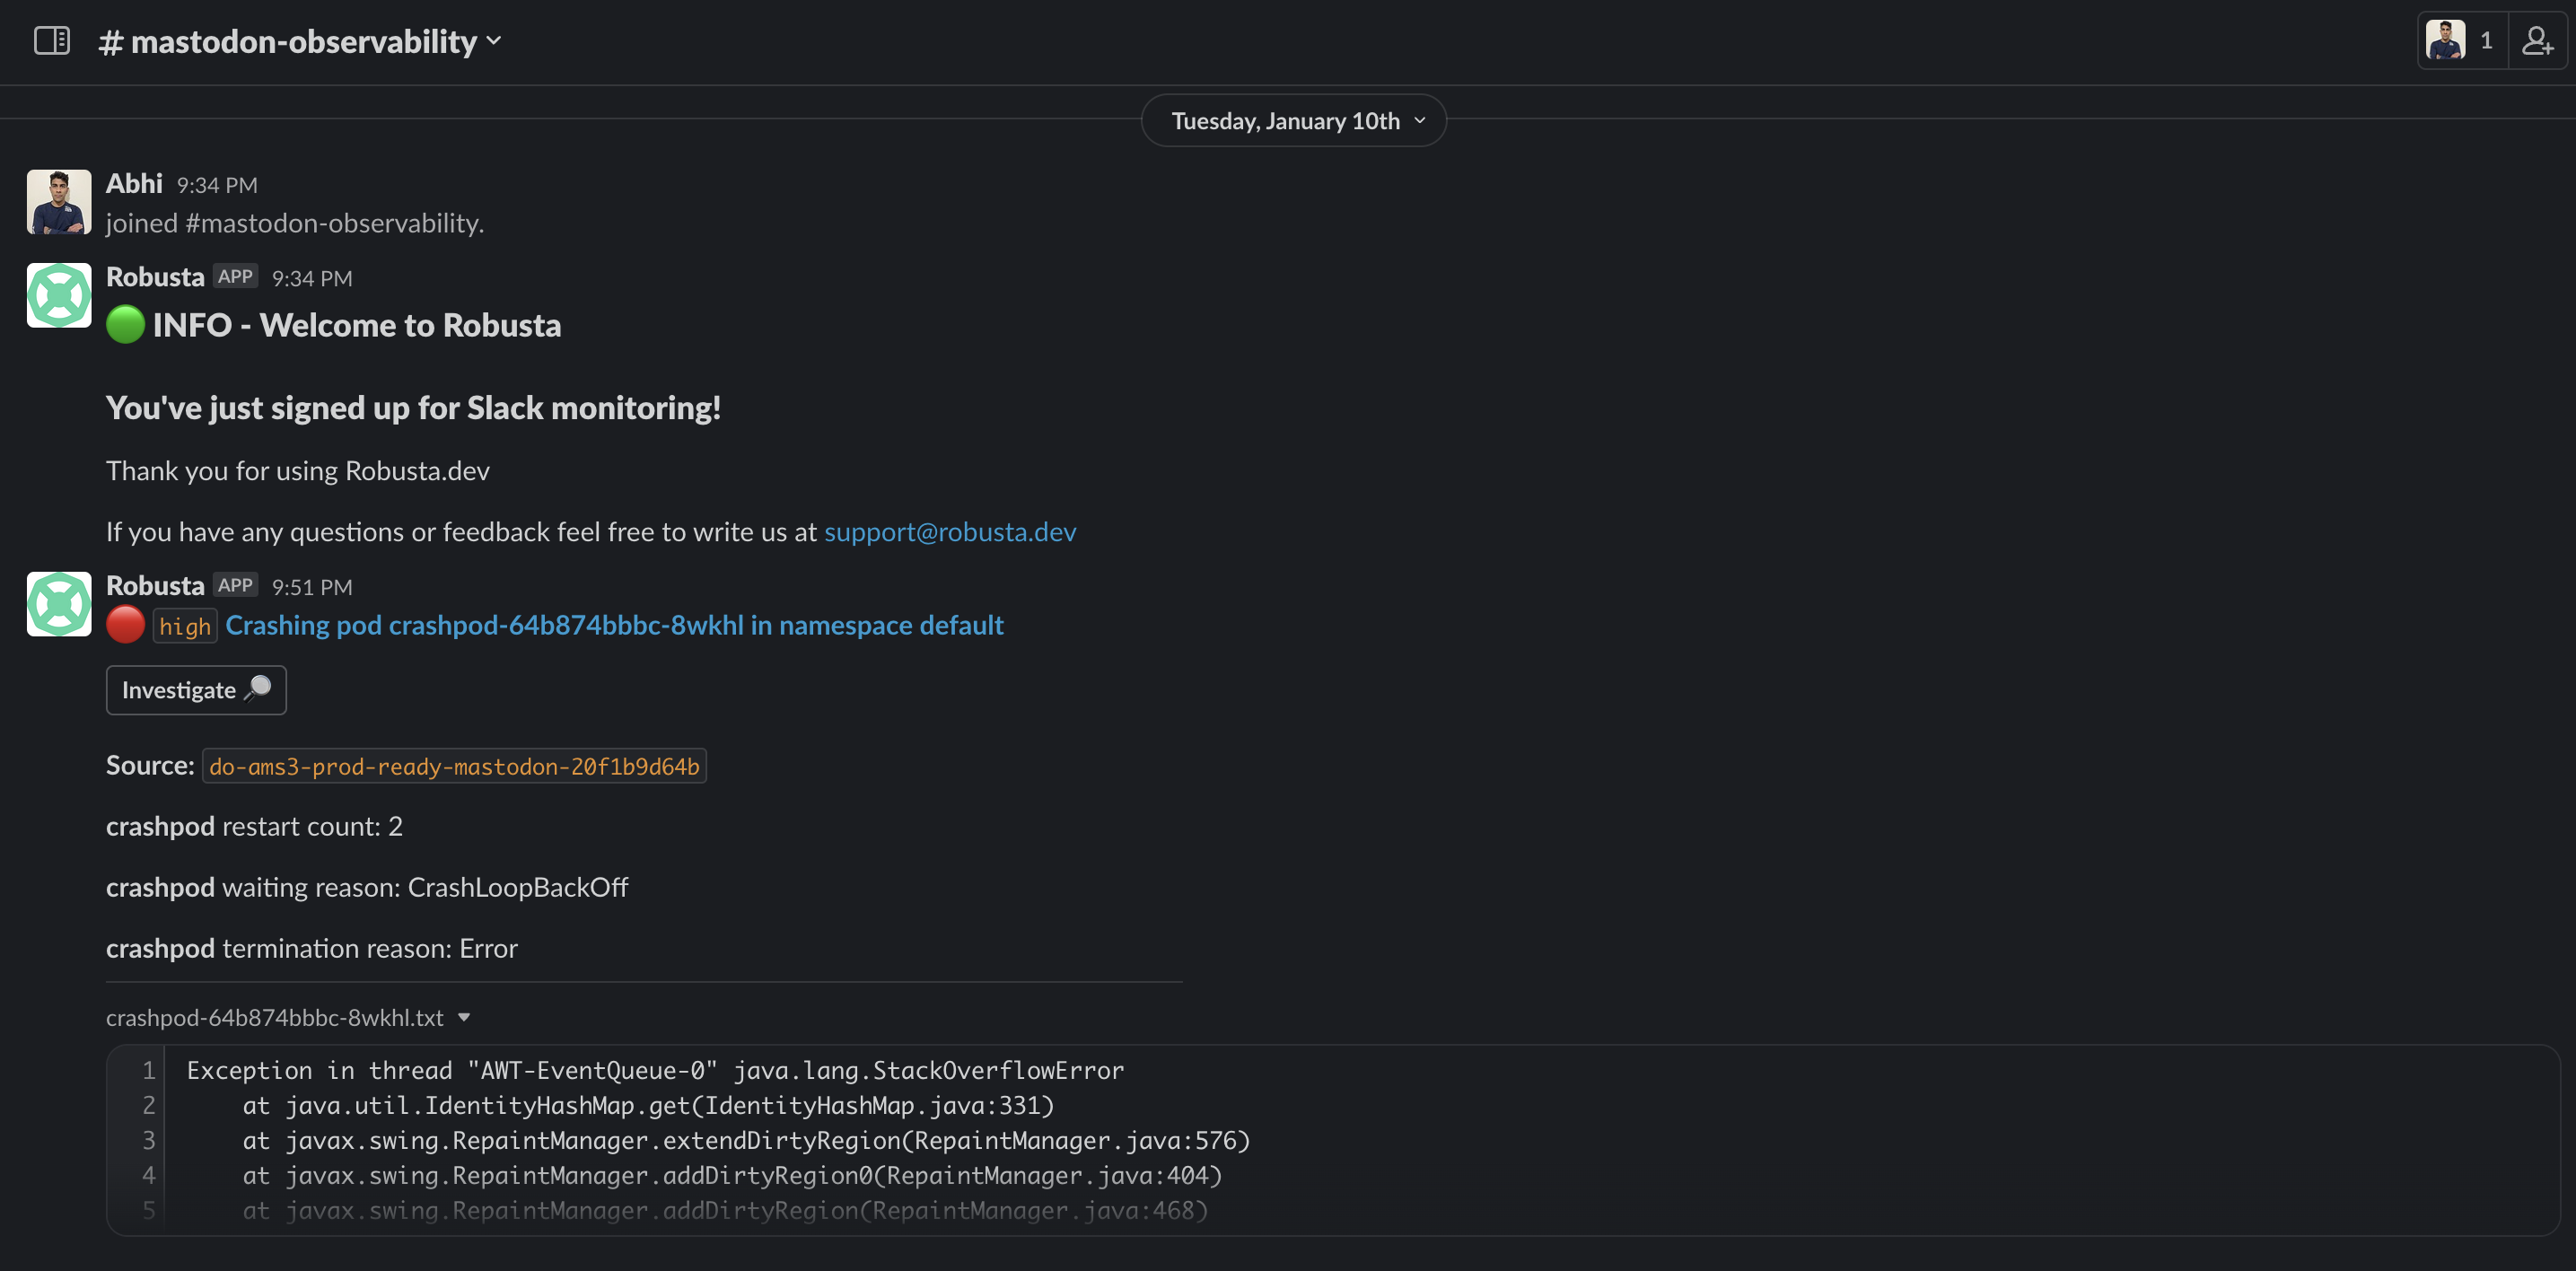
Receive slack alerts to your private slack channel.
Access Grafana Dashboards(optional)
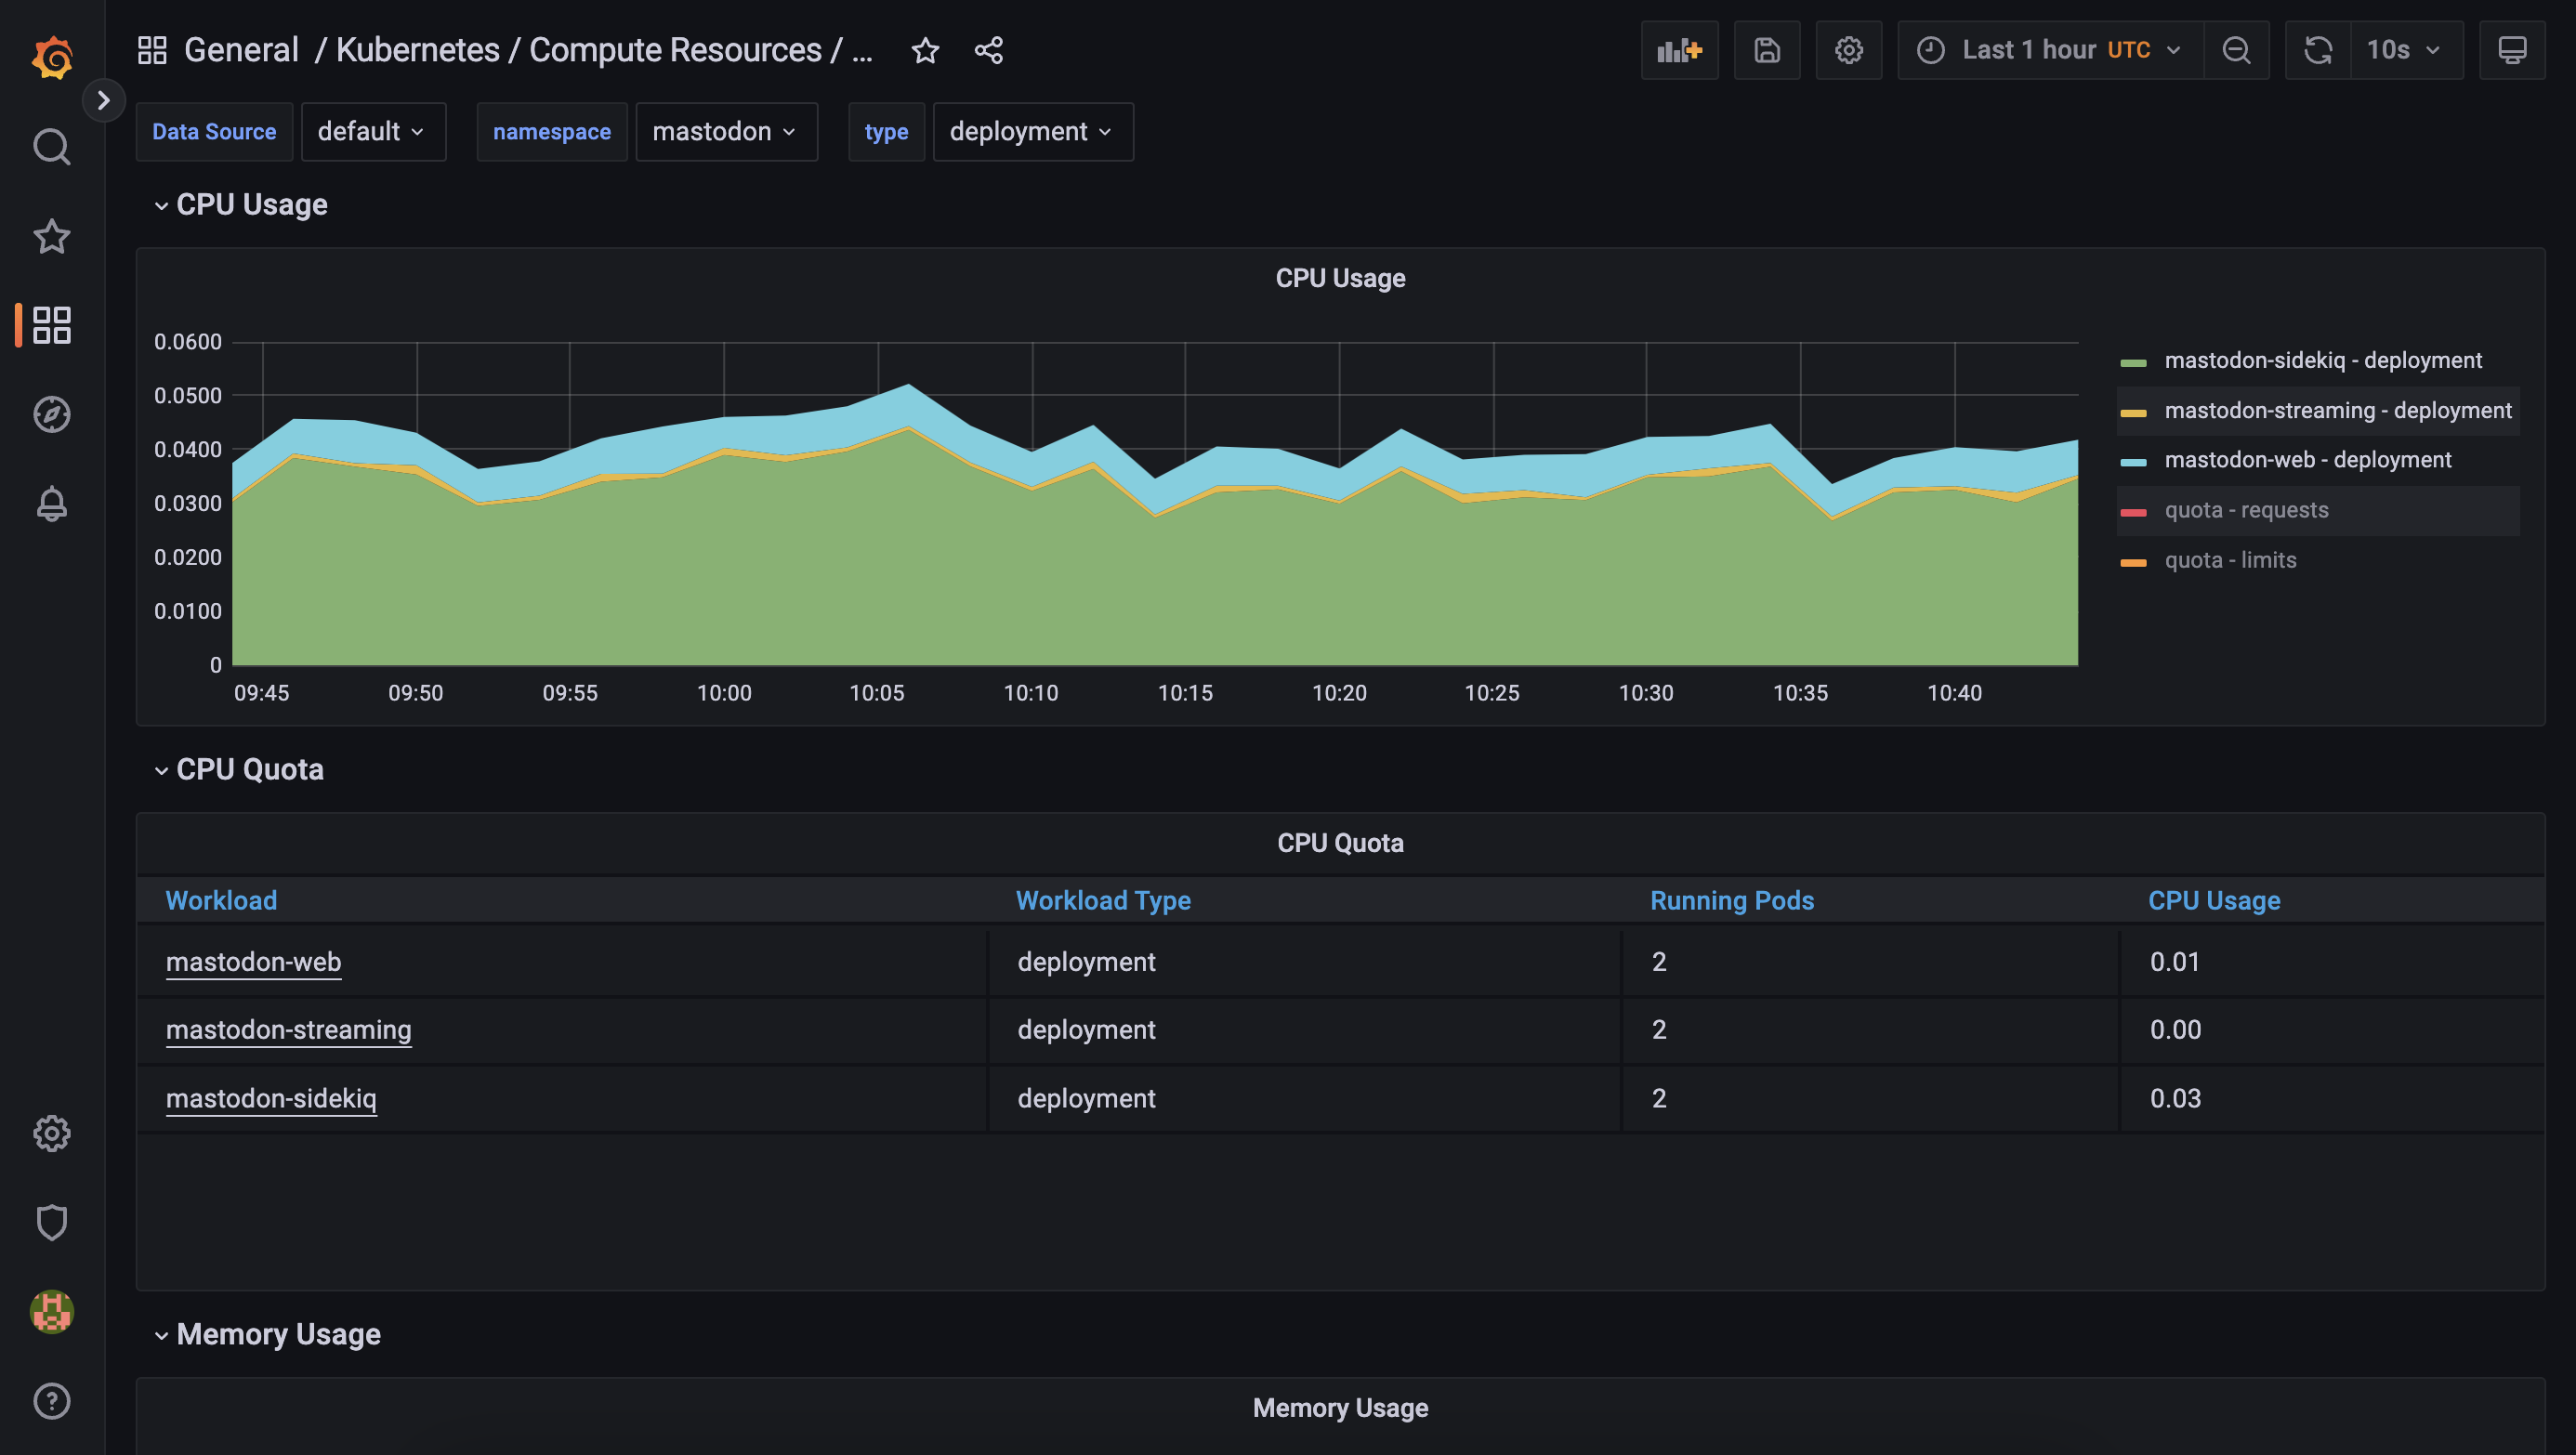
Additionally, you can use Grafana, which is part of the kube-prom-stack to visualize and query your data.
# Expose the robusta-grafana service
# log in with the credentials on localhost:3000

kubectl -n default port-forward svc/robusta-grafana 3000:80

# Open the browser and go to localhost:3000 to access Argo CD UI
# Login with username: `admin,` password: `prom-operator`
Conclusion
By understanding what is happening and why, Kubernetes observability helps you better visualize, manage, and optimize the unpredictable, distributed nature of Kubernetes deployments. With seamless integration into the DigitalOcean Kubernetes clusters, Robusta provides a single pane of glass for your observability stack. Check out this real-world example and get started with your observability journey.
Useful Resources
- Mastodon on DigitalOcean Kubernetes project uses Robusta for observability
- The Kubernetes Bootstrapper project leverages Robusta
- DigitalOcean Kubernetes: DIY Observability stack