How to Monitor Kafka Database Performance
Kafka is an open-source distributed event and stream-processing platform built to process demanding real-time data feeds. It is inherently scalable, with high throughput and availability.
DigitalOcean Managed Databases include metrics visualizations so you can monitor performance and health of your database cluster.
Cluster metrics monitor the performance of the nodes in a database cluster. Cluster metrics cover primary and standby nodes; metrics for each read-only node are displayed independently. This data can help guide capacity planning and optimization. You can also set up alerting on cluster metrics.
Database metrics monitor the performance of the database itself. This data can help assess the health of the database, pinpoint performance bottlenecks, and identify unusual use patterns that may indicate an application bug or security breach.
There are two groups of Kafka metrics: main server metrics, which are metrics on all databases in the cluster, and database metrics, which are metrics on individual database performance.
View Kafka Metrics
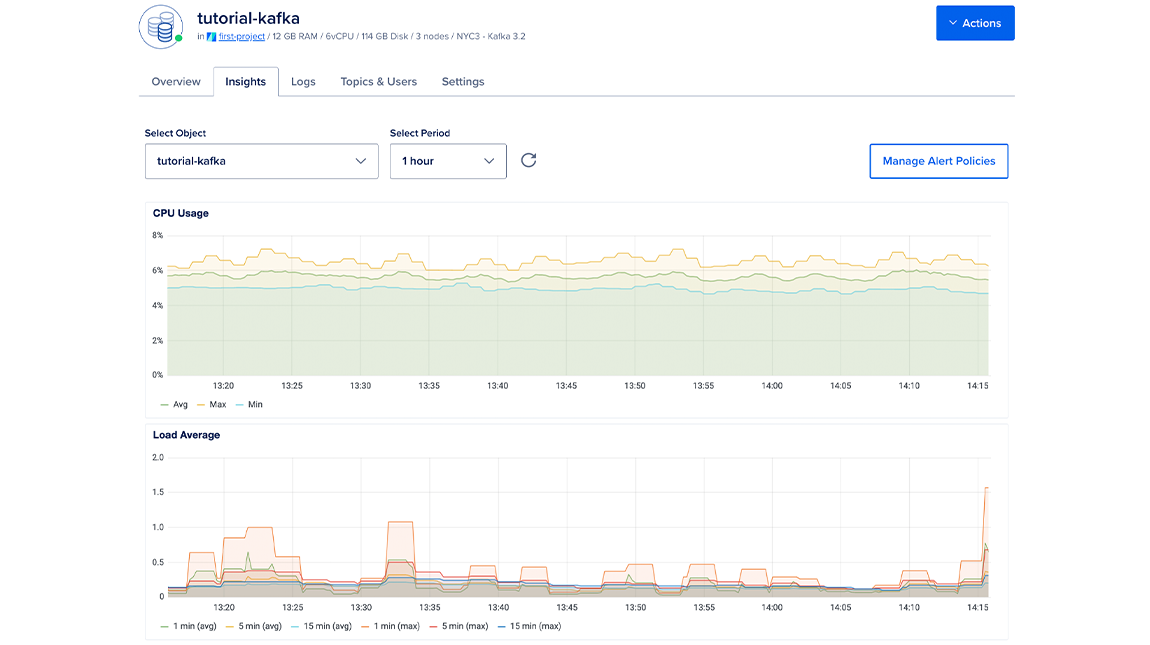
To view performance metrics for a Kafka database cluster, click the name of the database to go to its Overview page, then click the Insights tab.

The Select object drop-down menu lists the cluster itself and all of the databases in the cluster. Choose the database to view its metrics.
In the Select Period drop-down menu, you can choose a time frame for the x-axis of the graphs, ranging from 1 hour to 30 days. Each line in the graphs displays about 300 data points.
By default, the summary to the right shows the most recent metrics values. When you hover over a different time in a graph, the summary displays the values from that time instead.
If you recently provisioned the cluster or changed its configuration, it may take a few minutes for the metrics data to finish processing before you see it on the Insights page.
If you have 200 or more databases on a single cluster, you may be unable to retrieve their metrics. If you reach this limit, create any additional databases in a new cluster.
Kafka Main Server Metrics Details
Kafka-specific main server metrics include:
- Log Size (Largest Topics)
- Disk I/O
- Server - Messages per Second
- Server - Incoming Messages - Count
- Server - Bytes In and Out
- Network Requests per Operation
- Controller Offline Partitions
Main server metrics are displayed in the same view as cluster performance metrics.
Log Size (Largest Topics)
The log size plot presents the log size for each of your cluster’s largest Topics.
Disk I/O
The disk I/O plot presents the overall amount of data being written to and read from all nodes in the cluster.
Server - Messages Per Second
The messages-per-second plot presents the messages per second per node in the cluster.
Server - Incoming Messages - Count
The incoming messages plot presents the total number of messages received by the cluster by all nodes in the cluster.
Server - Bytes In and Out
The bytes-in-and-out plot presents the amount of bytes being sent and received by the cluster, organized into client bytes and replication bytes.
Network Requests Per Operation
The network requests per operation plot presents the amount of network requests across all nodes in the cluster for each of the following operations: FetchConsumer, FetchFollower, and Produce.
Controller Offline Partitions
The controller offline partitions plot presents the number of offline partitions per node in the cluster.
Access the Metrics Endpoint
You can also view your database cluster’s metrics programatically via the metrics endpoint. This endpoint includes over twenty times the metrics you can access in the Insights tab in the control panel.
You can access the metrics endpoint with a cURL command or a monitoring system like Prometheus.
Get Hostname and Credentials
First, you need to retrieve your cluster’s metrics hostname by sending a GET request to https://api.digitalocean.com/v2/databases/${UUID}. In the following example, the target database cluster has a standby node, which requires a second host/port pair:
curl --silent -XGET --location 'https://api.digitalocean.com/v2/databases/${UUID}' --header 'Content-Type: application/json' --header "Authorization: Bearer $RO_DIGITALOCEAN_TOKEN" | jq '.database.metrics_endpoints'
Which returns the following host/port pairs:
[
  {
    "host": "db-test-for-metrics.c.db.ondigitalocean.com",
    "port": 9273
  },
  {
    "host": "replica-db-test-for-metrics.c.db.ondigitalocean.com",
    "port": 9273
  }
]
Next, you need your cluster’s metrics credentials. You can retrieve these by making a GET request to https://api.digitalocean.com/v2/databases/metrics/credentials with an admin or write token:
curl --silent -XGET --location 'https://api.digitalocean.com/v2/databases/metrics/credentials' --header 'Content-Type: application/json' --header "Authorization: Bearer $RW_DIGITALOCEAN_TOKEN" | jq '.'
Which returns the following credentials:
{
  "credentials": {
    "basic_auth_username": "..."
    "basic_auth_password": "...",
  }
}
Access with cURL
To access the endpoint using cURL, make a GET request to https://$HOST:9273/metrics, replacing the hostname, username, and password variables with the credentials you found in the previous steps:
curl -XGET --silent -u $USERNAME:$PASSWORD https://$HOST:9273/metrics
Access with Prometheus
To access the endpoint using Prometheus, first copy the following configuration into a file prometheus.yml, replacing the hostname, username, password, and path to CA cert. This configures Prometheus to use all the credentials necessary to access the endpoint:
# prometheus.yml
global:
  scrape_interval: 15s
  evaluation_interval: 15s

scrape_configs:
  - job_name: 'dbaas_cluster_metrics_svc_discovery'
    scheme: https
    tls_config:
      ca_file: /path/to/ca.crt
    dns_sd_configs:
    - names:
      - $TARGET_ADDRESS
      type: 'A'
      port: 9273
      refresh_interval: 15s
    metrics_path: '/metrics'
    basic_auth:
      username: $BASIC_AUTH_USERNAME
      password: $BASIC_AUTH_PASSWORD
Then, copy the following connection script into a file named up.sh. This script runs envsubst and starts a Prometheus container with the config from the previous step:
#!/bin/bash
envsubst < prometheus.yml > /tmp/dbaas-prometheus.yml

docker run -p 9090:9090 \
  -v /tmp/dbaas-prometheus.yml:/etc/prometheus/prometheus.yml \
  prom/prometheus
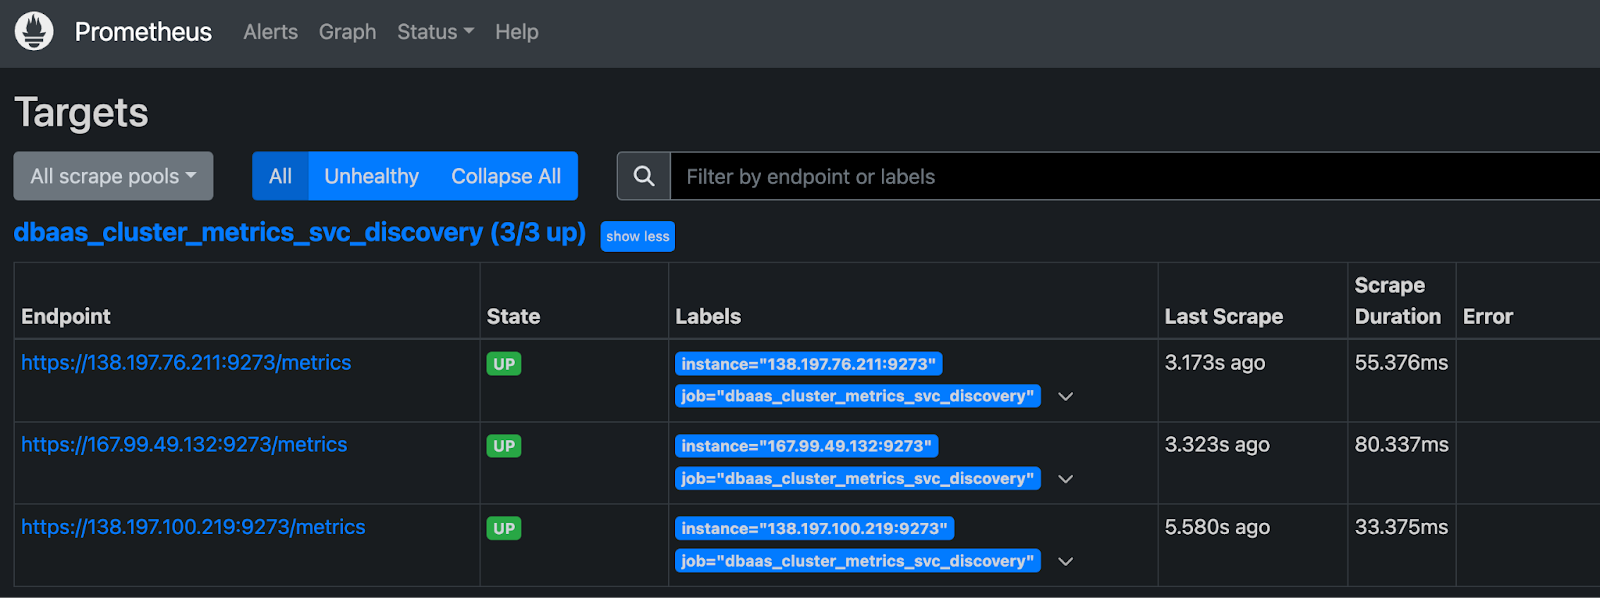
Go to http://localhost:9090/targets in a browser to confirm that multiple hosts are up and healthy.

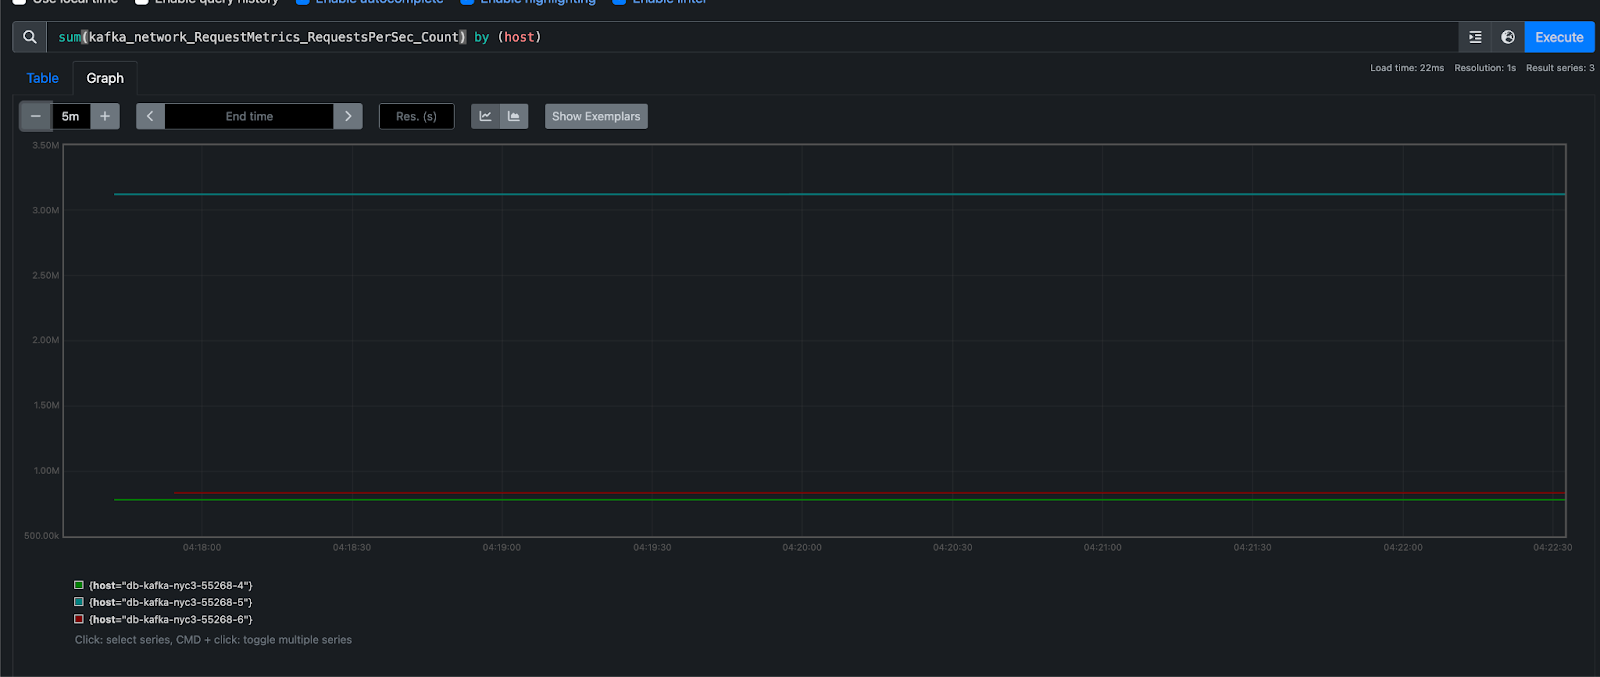
Then, navigate to http://localhost:9090/graph to query Prometheus for metrics.

For more details, see the Prometheus DNS SD docs and TLS config docs.
Additional Resources
For more details on each available metric, see the Kafka documentation.