How to Set Up Resource Alerts
DigitalOcean Monitoring is a free, opt-in service that gathers and displays metrics about Droplet-level resource utilization. Monitoring supports configurable alert policies with integrated email and Slack notifications to help you track the operational health of your infrastructure.
Resource alerts send notifications via Slack or email when Droplet metrics, like CPU usage or bandwidth, fall outside of a threshold you set.
Create Resource Alerts
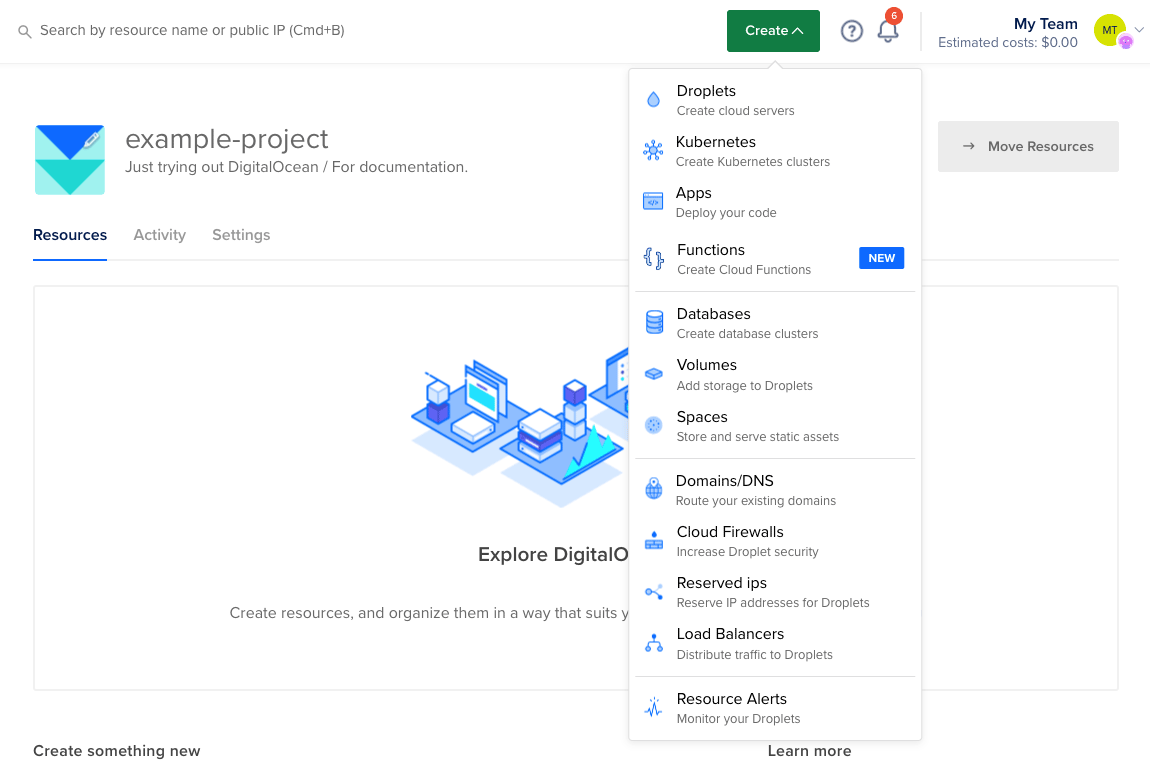
Once the metrics agent is running, you can create resource alerts. In the Create menu, click Resource Alerts:

This opens the resource alert creation page.
The pattern for defining an resource alert is the same for all metrics: choose a metric, a threshold, and an alert interval.
-
Choose the metric:
- CPU: The percentage of total CPU used on the Droplet, out of 100%
- Bandwidth — Inbound: The amount of incoming traffic to the Droplet, in Mbps
- Bandwidth — Outbound: The amount of outgoing traffic from the Droplet, in Mbps
- Disk — Read: The read activity for the Droplet’s disks, in MB/s
- Disk — Write: The write activity for the Droplet’s disks, in MB/s
- Memory Utilization: The percentage of total memory being used, out of 100%
- Disk Utilization: The percentage of the root disk storage being used, out of 100%
-
Specify the usage threshold itself as either a percentage of the total available capacity being used or as a usage rate, depending on the selected metric.
An appropriate value here depends on the metric, the goal of the alert, and the typical server usage patterns. In most scenarios, alerting when usage climbs above the threshold is the more helpful option because high usage tells us that the current resources may no longer be sufficient.
-
Pick the alert interval, which is how long a Droplet must exceed the threshold before a notification is triggered:
- 5 minutes
- 10 minutes
- 30 minutes
- 1 hour
Apply the Resource Alert to Droplets
The Select Droplets or Tags section includes a field where you apply the alert policy to specific Droplets or groups of Droplets.
Adding Droplets by name allows you to target individual resources unambiguously. Adding tags to an alert policy provides flexibility in deciding which Droplets are covered by the policy by adding or removing tags from Droplets.
Select the Alert Notification Method
To create a policy, you must select at least one of the two possible notification methods: email or Slack. The first choice, checked by default, is the verified email address of the account you’re using when you create the policy.
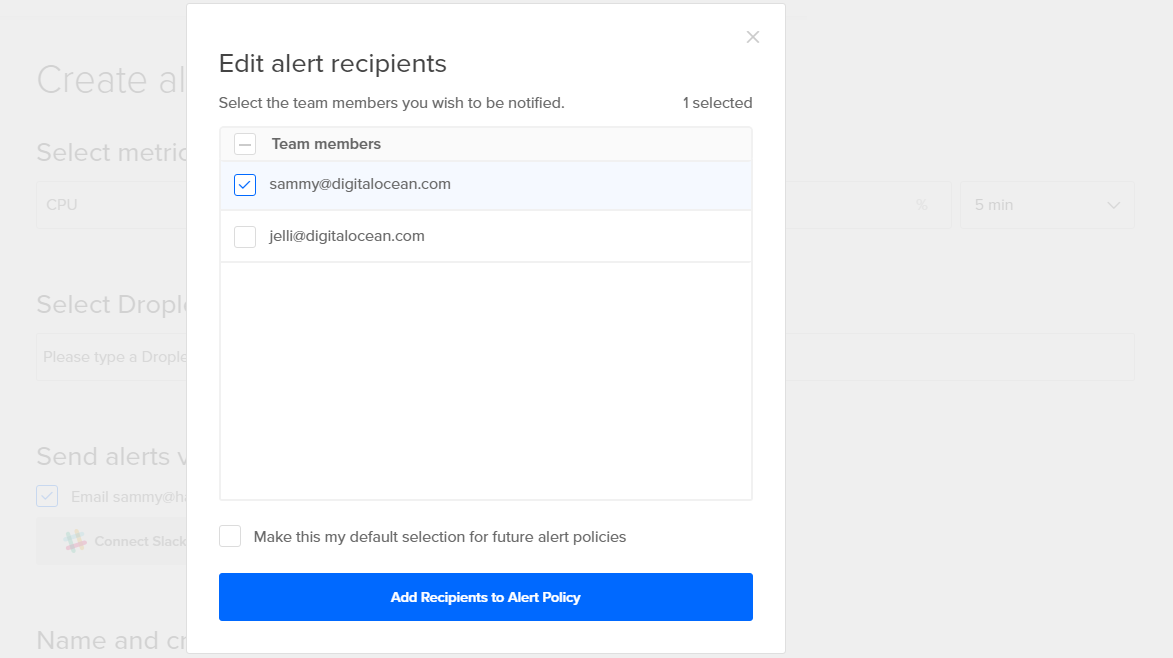
When you create an alert policy from a Team account, you’ll have the option to select any of your teammates as email recipients for an alert. When you click Add more recipients, you’ll be given a list of your team’s email addresses. Select each address individually or use the checkbox by the Team members header to select or deselect all the addresses on the list.

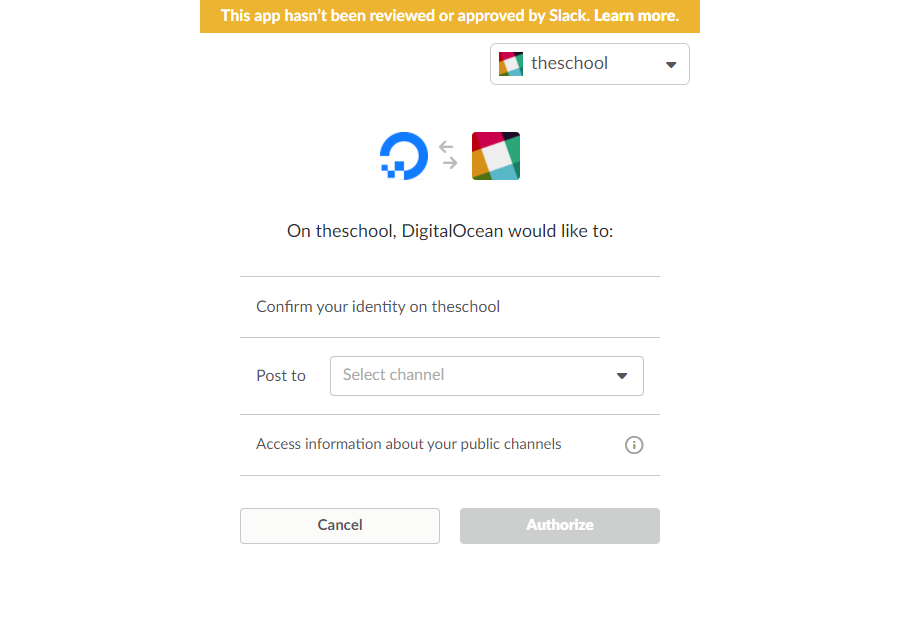
If you are part of a Slack organization, you can choose to connect your Slack account to receive notifications in Slack. Click the Connect Slack button to authorize DigitalOcean to create notifications within your Slack organization:

On the authorization page that follows, you can select any Slack teams you are authenticated to or log in to a different team.
You can then choose to notify Slackbot (which will send messages only to you), notify a channel, or notify any person or group through direct messages.

Once you’ve authorized the link between DigitalOcean Monitoring and a Slack team, that connection will be available and enabled by default the next time you create an alert policy. If you choose to unlink in a new alert policy, you’ll be able to select a different channel or a different team without affecting any previous connections.
Name and Create the Alert Policy
Finally, choose a unique and descriptive name for the alert policy. This name will be used to identify this specific alert policy when notifications are sent.
The name you choose will:
- Identify the policy on the Monitoring index page.
- Form part of the subject line of the email alert.
When everything is configured, clicking the Create alert policy button will create the policy and kick off the evaluation of incoming data.
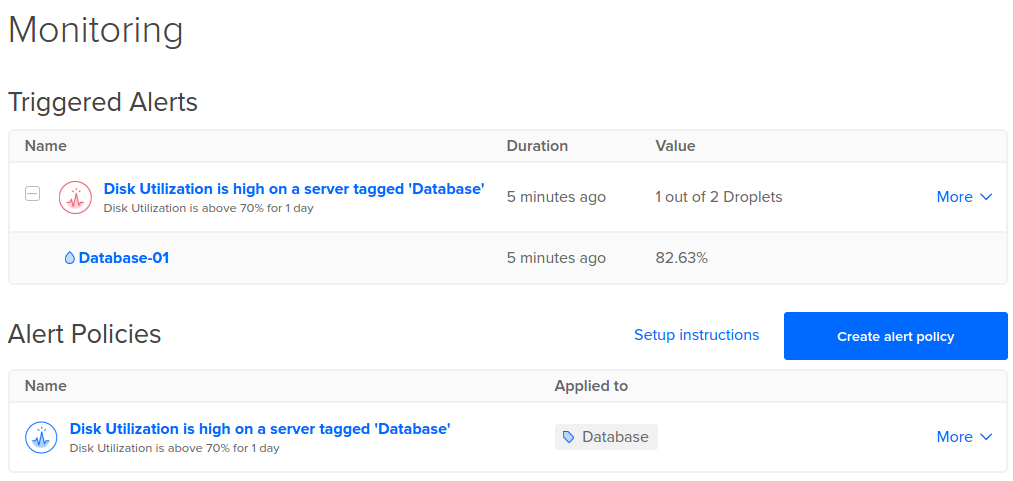
The new policy will appear on the Monitoring page under a section called Alert Policies:

Receiving Notifications and Viewing Triggered Alerts
When you first create a resource alert, it may take a few minutes before the alerting service begins evaluating incoming data. After that delay, each time the alerting service receives a new data point from the monitoring agent, it replaces the oldest data point with the newest and reevaluates the average of the threshold interval.
If the average of the data points in the alert interval exceeds the threshold, the service triggers an alert. When the average of the data points in the alert interval falls back within the threshold, the service resolves the alert. At this time, it is not possible to manually resolve or acknowledge an alert.
When the alerting service triggers an alert or resolves an alert, it sends a notification using the method you’ve chosen (either email or Slack). Each notification includes the name of the alert, the name and IP address of the triggering Droplet, and a link to the triggering Droplet’s page in the control panel. Additionally, notifications about triggered alerts include the alert policy parameters and the average resource usage at the time the alert was triggered. Resolution notifications include the length of the alert event and the current average resource usage.
Control Panel Alerts
Triggered alerts are visible on the Monitoring page in the Triggered Alerts section. This section is only visible when there are active alerts:

Email Alerts
If you’ve selected email notifications, you will receive a notification email when an alert is triggered:
Subject: DigitalOcean monitoring triggered: CPU is running high - example_droplet

CPU Utilization Percent is currently at 71.56%, above setting of 70.00% for the last 5m

View droplet: https://cloud.digitalocean.com/droplets/12345
IP: 203.0.113.1
Edit monitor: https://cloud.digitalocean.com/monitors/b0fa6de7-00ex-ampl-e920-e52eeb35a903
Once the alert has been resolved, a similar resolution email will be sent:
Subject: DigitalOcean monitoring resolved: Disk Utilization is high on a server tagged 'Database' - Database-01
The monitor was triggered for more than 1 hour.
Disk Utilization is currently at 69.70%.

View droplet Database-01: https://cloud.digitalocean.com/droplets/12345678
IP: 203.0.113.1
This indicates that the alert has been resolved.
Slack Alerts
If you’ve enabled Slack notifications, you will receive a notification in Slack in the team and channel selected in the alert policy:

Once the average resource consumption has dipped below the threshold again, the alert service sends a similar Slack notification to indicate that the alert has been resolved:
